Enterprises generate vast amounts of information across customers, systems, and interactions, yet much of its value is lost when the connections between those elements remain invisible. Customer details live in a CRM, transactions are tracked in finance systems, and interactions are scattered across digital channels. Traditional databases store attributes efficiently, but they fall short when it comes to representing the dimension that often carries the most insight: how entities are related.
As AI and automation scale into enterprise workflows, those relationships are no longer an optional detail. They provide the context that determines whether outputs are accurate, relevant, and aligned with business goals. Graph data addresses this by modeling not just data points, but how they connect, transforming disconnected records into connected intelligence.
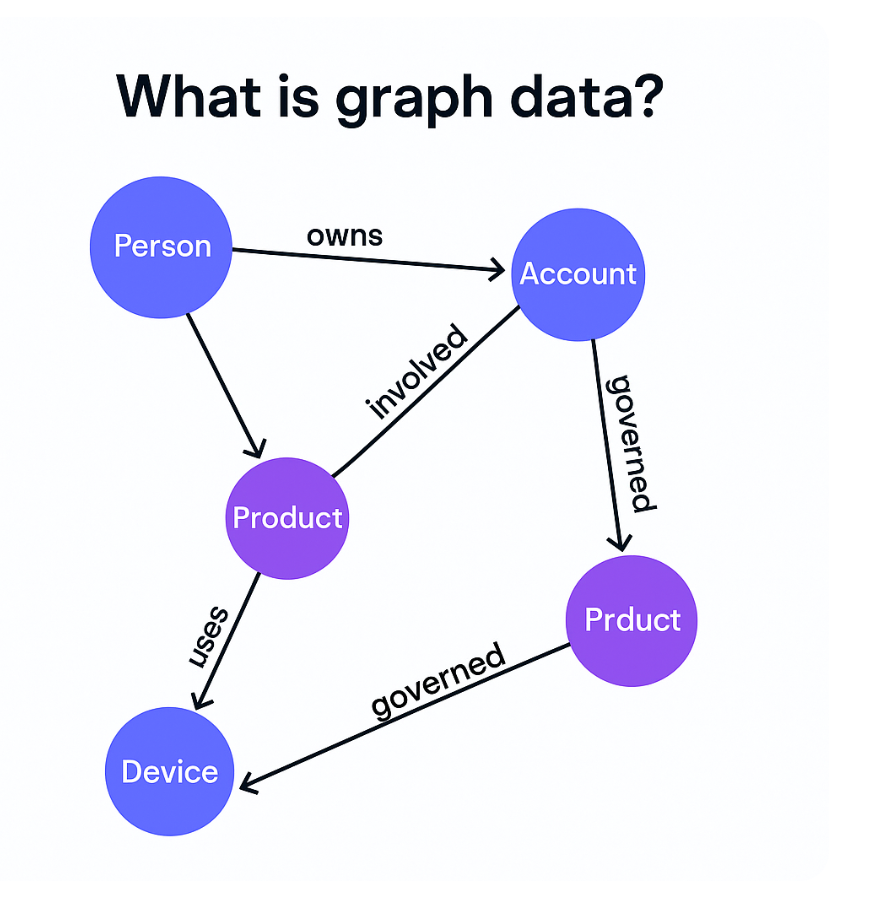
What is graph data?
Graph data is a data model that represents entities and their relationships using nodes and edges. Nodes represent entities such as people, accounts, or devices. Edges represent the relationships between them, such as ownership, interaction, dependency, or hierarchy. Both nodes and edges can carry attributes, allowing data to capture not just values, but the connections that give them meaning.
Unlike rows in a table, a graph structure can naturally reflect the complexity of real-world systems. A single model can show a customer linked to multiple accounts, accounts linked to transactions, transactions tied to products, and policies that govern usage. This approach makes relationships a core part of the data model, rather than something reconstructed through joins.
This difference becomes clearer when compared to how traditional relational databases structure and query data.
Graph data vs relational data models
Traditional relational databases organize data in tables made up of rows and columns. Relationships between data points are not stored directly, but recreated through joins across tables. While this works well for structured data, it becomes complex and inefficient when relationships are numerous or constantly changing.
Graph data takes a different approach. Instead of separating data and relationships, it models both as part of the same structure. Entities are connected directly through relationships, making it easier to represent and query how data points interact.
In practice, this leads to key differences:
- Relationships are first-class elements: Graph data stores connections directly, rather than reconstructing them through joins
- Queries follow connections naturally: Traversing relationships is faster and more intuitive than joining multiple tables
- Flexibility at scale: Graph models adapt more easily as new data types and relationships are introduced
For use cases that depend on context, such as customer journeys, fraud detection, or AI-driven decisions, graph data provides a more natural and scalable way to represent real-world complexity.
Why graph data matters for enterprises
Enterprises depend on data to run daily operations, understand customers, manage risk, and innovate. But when information is locked in silos or stripped of its relationships, it limits what organizations can see and do with their data. Graph-based systems address this by making relationships explicit and queryable, turning fragmented systems into connected networks of meaning. This connected structure also enables more advanced approaches to graph data integration across enterprise applications, where data from multiple systems can be unified without losing context.
With graph data, enterprises can:
- Connect across silos: unify records from multiple platforms into a coherent structure.
- Gain context-rich insights: understand not just attributes, but how entities interact and depend on one another.
- Improve decision-making: identify patterns, paths, and risks that are invisible in tabular views.
- Adapt quickly: extend models as new data types and relationships emerge, without rigid restructuring.
By representing data in this connected form, enterprises unlock visibility across their operations, enabling more accurate analysis, stronger governance, and the ability to mobilize information for a wide range of applications.
Key benefits of graph data modeling
Modeling data in graph form changes how enterprises can see, understand and use it. Instead of just storing values, graph structures make relationships explicit and carry context alongside information. This creates qualities that are directly useful to business and technical teams:
- Relationships as part of the model: connections are represented directly, so context is preserved rather than being reconstructed in each application.
- Context carried with the data: entities and their links can include descriptive attributes, giving systems the ability to understand meaning as data moves.
- Flexibility to reflect change: new types of entities or relationships can be incorporated as business requirements evolve, without reworking entire data structures.
- Visibility across domains: queries can surface chains of interaction, clusters of related entities, or dependencies that would remain hidden in siloed records.
These attributes make graph data modeling valuable not just for storing information, but for making it usable in practice – a connected resource that supports enterprise decision-making, compliance, and innovation.
From data silos to connected intelligence with graph data
When information is modeled as a graph, it shifts from being a collection of isolated records to a connected map of relationships. A single view can reveal the chain from a supplier to an inventory item, through logistics to delivery, and on to the customer who received it. The same structure can show how accounts link to people, policies, and transactions across different systems.
This connected perspective makes dependencies, overlaps, and relationships visible in ways that traditional data models cannot. Business teams can follow chains of interaction, risk teams can trace exposure across domains, and product teams can understand how engagement spans multiple channels. Instead of piecing context together system by system, enterprises gain a unified model where relationships are explicit, persistent, and ready to be used.
Building connected intelligence with graph data
Graph data provides enterprises with a structural fabric where relationships are captured as part of the data itself. This connected model supports a richer view of operations, customers, and ecosystems, allowing teams to analyze not only entities but the chains of interaction and dependency that bind them.
Within this fabric, patterns emerge that are difficult to surface in other models: clusters of related entities, paths that cut across domains, and dependencies that reveal where processes are fragile or resilient. This perspective strengthens decision-making, enabling organizations to anticipate impacts, trace outcomes, and align data-driven initiatives with real-world complexity.
Enterprises that model their information as a graph gain a foundation for connected intelligence — a representation of relationships that evolves with their environment and scales with new demands. It is on this foundation that organizations can embed the clarity, consistency, and governance needed to make connected data a trusted asset across teams, systems, and ecosystems.
The next step is operationalizing graph data in enterprise systems, where this connected model is applied directly in workflows, AI systems, and governance processes, turning data into an active part of decision-making.